- Flight planning
- 10 minute read
- Updated
- By The FlyFren Team
US Airports by the Numbers: Towers, Fuel and Runways
FlyFren counted every public-use US airport in the FAA's October 2026 NASR data: towers, paved runways, fuel, approaches and how your state compares.
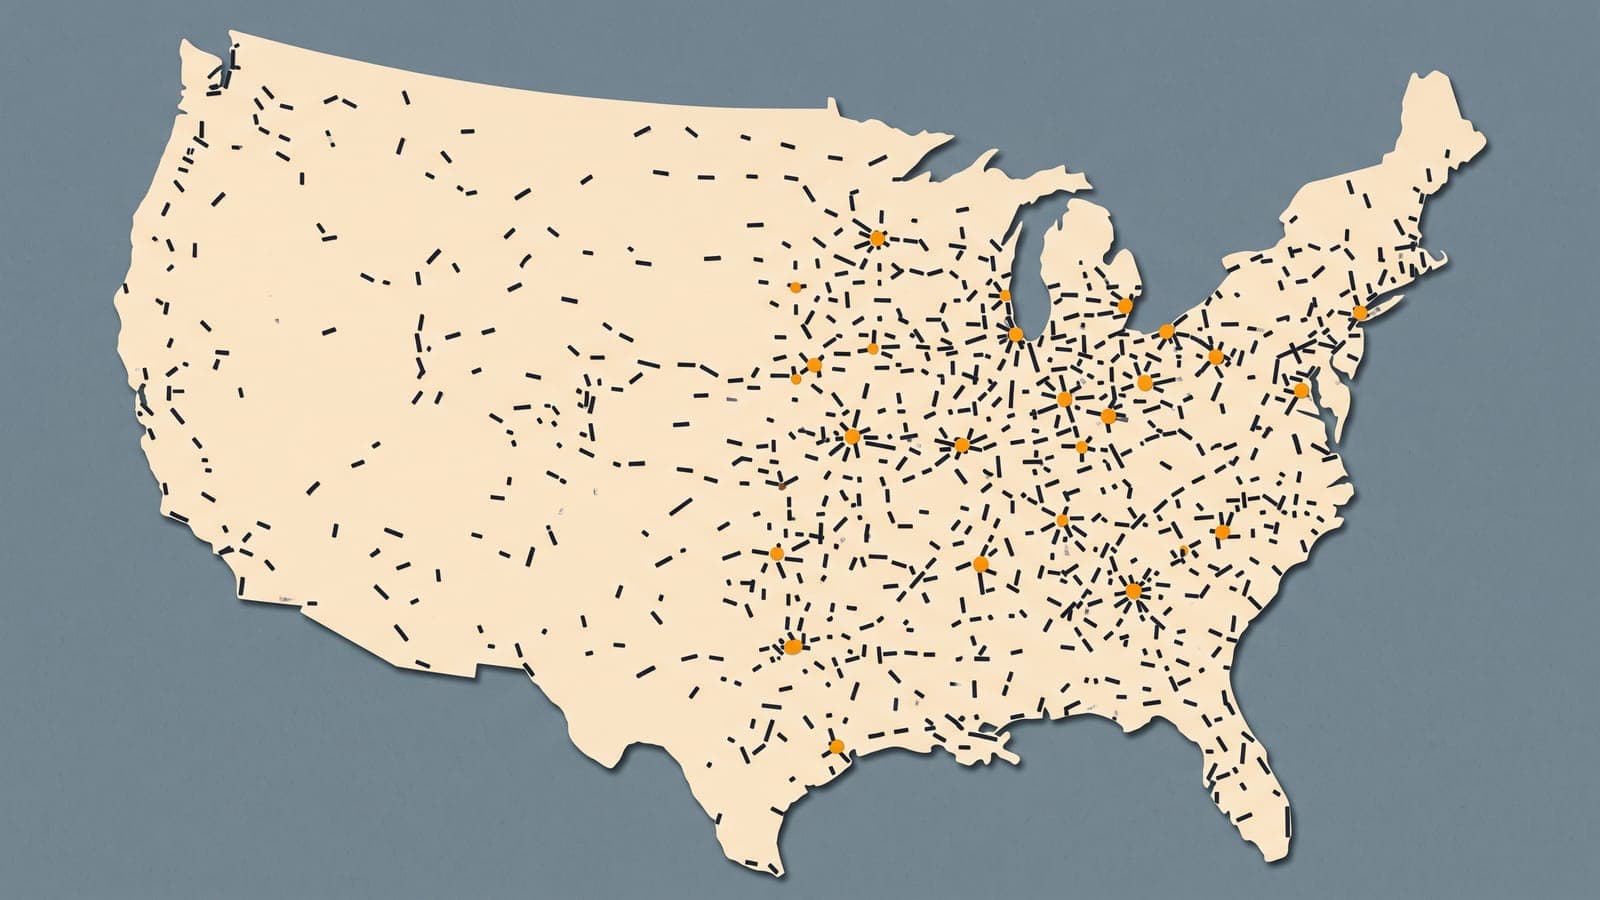
The FAA's airport database for the cycle effective October 1, 2026 lists 19,427 landing facilities, and 4,767 of them are airports in the United States that are open to the public. The rest are private strips, heliports, seaplane bases and a handful of gliderports and balloonports. Everything below is about those 4,767, because they are the ones a student on a cross-country can plan to land at.
We counted them because FlyFren imports this data every 28 days to build its airport pages, and a database you maintain is one you should occasionally question. Only about one airport in nine has a control tower. One in three lists no fuel at all. Alaska has 283 public-use airports and 57 of them are paved.
How we counted
The source is the FAA's 28 Day NASR Subscription, the National Airspace System Resources data the FAA publishes every 28 days. We used the cycle effective October 1, 2026, and ran the queries on October 3, 2026. NASR carries a few facilities outside the United States (105 in this cycle, mostly in Canada and the Bahamas); we excluded them.
An airport counts as public use when NASR's facility use code is PU rather than PR. That is a legal status set by the owner. It says nothing about condition. Of the 4,767, 3,980 are publicly owned and 766 are privately owned but open to the public, with the remaining 21 under military or other ownership codes. Heliports (57 public-use), seaplane bases (225), gliderports (4), ultralight fields (3) and the single public-use balloonport are excluded; the count is airports, NASR site type A.
Four definitions do the rest of the work. Towered means NASR lists a tower local-control frequency for the airport, and because part-time towers count, a tower in this table is not a promise that it is open when you arrive. Paved means at least one open runway whose surface code begins with asphalt or concrete. Fuel is NASR's fuel-types field: 100LL covers the codes 100LL and 100, and Jet covers A, A+, A++, A1, A1+, J and J8. An instrument approach means at least one published instrument approach procedure in the same cycle. Population figures are the Census Bureau's Vintage 2025 state estimates for July 1, 2025.
One thing we could not count. NASR records runway edge lighting, but our import does not carry that field yet, so the only lighting figure below is visual glideslope indicators (PAPI or VASI), which NASR records per runway end.
Only one public-use airport in nine has a tower
Of 4,767 public-use airports, 539 have a tower frequency listed, which is 11.3 percent. The other 4,228 are non-towered, and 4,433 of all 4,767 list a CTAF.
The share swings hard by state. Florida has towers at 42 of its 122 public-use airports, 34 percent, and California at 49 of 243, 20 percent. Texas, with the most airports of any state, has 46 towers among 385, which is 12 percent. Alaska has 9 among 283, or 3 percent.
For a pilot, the number says where the training should go. Nine of every ten airports you could land at want position reports on CTAF, not clearances, and the AIM's non-towered procedures get more use than the tower phraseology most students practice first. It also says to check tower hours in the Chart Supplement before assuming the Class D is active.
Four in five have pavement; in Alaska it is one in five
3,838 of the 4,767 airports, 80.5 percent, have at least one open asphalt or concrete runway. The rest are turf, gravel, dirt, sand or water.
The exceptions cluster in the Northwest, with one outlier. Alaska has pavement at 57 of 283 public-use airports (20 percent) and Idaho at 55 of 125 (44 percent). Montana sits at 82 of 124 and Washington at 98 of 119. The outlier is Michigan, at 127 of 205 (62 percent). At the other end, every one of Tennessee's 74 and Louisiana's 69 public-use airports has pavement, and Arkansas has it at 97 of 100.
Your POH's takeoff and landing tables state the runway surface they assume, and the notes under them say what to add for anything else. Read the notes. If a fifth of the airports on your route are turf or gravel, that correction is part of the planning, not a footnote.
The median longest runway is 4,100 feet
Half of US public-use airports have no runway longer than 4,100 feet. The distribution is wide, and it has two humps. One sits at 3,000 to 3,999 feet, where small municipal fields live; the other at 5,000 to 6,999 feet, where county and regional airports were built for business jets.
| Longest runway | Airports | Share |
|---|---|---|
| Under 3,000 ft | 887 | 18.6% |
| 3,000 to 3,999 ft | 1,200 | 25.2% |
| 4,000 to 4,999 ft | 828 | 17.4% |
| 5,000 to 6,999 ft | 1,335 | 28.0% |
| 7,000 to 9,999 ft | 377 | 7.9% |
| 10,000 ft and over | 140 | 2.9% |
Computed from NASR runway records for the October 1, 2026 cycle, excluding water runways. The longest single runway in the set is 16R/34L at Denver International (KDEN) at 16,000 feet.
14 CFR 91.103(b) requires every pilot, for every flight, to know the runway lengths at airports of intended use and the takeoff and landing distance data for the airplane. The 887 airports under 3,000 feet are where that paragraph earns its keep on a hot afternoon, when density altitude has already taken a bite out of the POH numbers.
Two in three sell 100LL, and one in three list no fuel
3,174 airports (66.6 percent) list 100LL, and 2,271 (47.6 percent) list a jet fuel. Almost every jet-fuel airport also has avgas: 2,239 carry both. At the other end, 1,549 airports, 32.5 percent, list no fuel of any kind.
The unleaded transition is barely visible in the data yet. Only 42 airports list an unleaded avgas (UL94, UL91 or G100UL) and 77 list MOGAS.
A fuel code in NASR says a pump exists. It does not say the pump works today or that the FBO is open on Sunday. 14 CFR 91.151 wants an airplane to carry 30 minutes of reserve by day and 45 at night at normal cruising speed; the one-in-three figure is why planning that reserve around a single fuel stop is a thin plan. Call the FBO.
Most have an instrument approach, few have an ILS
3,031 airports (63.6 percent) have at least one published instrument approach procedure, and 2,993 (62.8 percent) have an RNAV approach. An ILS or localizer is far rarer: 799 airports, 16.8 percent. There are 2,232 airports with an approach but no ILS. That is the GPS era in one number. Across all 4,767 airports the cycle carries 10,167 approach procedures, and 6,637 of them, almost two-thirds, are RNAV (GPS) approaches.
A VFR pilot should read that as traffic information. At nearly two-thirds of the airports you could land at, an IFR aircraft may be arriving on a straight-in final from 5 miles out, below the clouds you are circling under. Listen for "procedure turn inbound" and "straight-in RNAV" on CTAF. For the instrument student, the 2,232 approach-but-no-ILS airports are where most of your approaches will be flown after the checkride.
Visual glideslope guidance at 63 percent
2,996 airports (62.8 percent) have a PAPI or VASI on at least one runway end. Counting the base end of each runway, the most common installation is the four-box PAPI on the left (code P4L, 1,530 runways), then the two-box PAPI on the left (P2L, 1,377).
That leaves 1,771 public-use airports with no visual glideslope at all. At night those are the fields where the featureless terrain illusion in AIM 8-1-5, which "can create the illusion that the aircraft is at a higher altitude than it actually is" over darkened areas, has nothing to correct it. If the Chart Supplement shows no PAPI, plan the night arrival with a known altitude at a known distance.
The states, ranked by count and by airports per person
Texas has the most public-use airports, 385, followed by Alaska (283), California (243), Michigan (205) and Kansas (149). Rhode Island has the fewest of the 50 states with 7, then Delaware (10), Hawaii (14), Vermont (16) and Connecticut (20). The District of Columbia has 3.
Per person, the map inverts. Alaska has 38.4 public-use airports per 100,000 residents, more than three times North Dakota in second place (11.1), with Montana (10.8), South Dakota (7.4) and Wyoming (7.1) behind. The bottom five are New Jersey (0.4), the District of Columbia (0.4), Maryland (0.5), Massachusetts (0.5) and Florida (0.5). Texas, with the most airports, ranks in the lower half per person at 1.2.
| State | Airports | Towered | Paved | With approach | Population (2025) | Per 100,000 |
|---|---|---|---|---|---|---|
| Texas | 385 | 46 | 329 | 234 | 31,709,821 | 1.2 |
| Alaska | 283 | 9 | 57 | 147 | 737,270 | 38.4 |
| California | 243 | 49 | 237 | 150 | 39,355,309 | 0.6 |
| Michigan | 205 | 17 | 127 | 100 | 10,127,884 | 2.0 |
| Kansas | 149 | 7 | 112 | 82 | 2,977,220 | 5.0 |
| Ohio | 143 | 14 | 122 | 105 | 11,900,510 | 1.2 |
| Minnesota | 136 | 8 | 115 | 105 | 5,830,405 | 2.3 |
| Oklahoma | 130 | 9 | 120 | 71 | 4,123,288 | 3.2 |
| Idaho | 125 | 6 | 55 | 25 | 2,029,733 | 6.2 |
| Montana | 124 | 6 | 82 | 47 | 1,144,694 | 10.8 |
| Florida | 122 | 42 | 107 | 96 | 23,462,518 | 0.5 |
| Wisconsin | 122 | 13 | 98 | 88 | 5,972,787 | 2.0 |
| Missouri | 120 | 11 | 112 | 84 | 6,270,541 | 1.9 |
| Washington | 119 | 12 | 98 | 39 | 8,001,020 | 1.5 |
| New York | 117 | 17 | 85 | 70 | 20,002,427 | 0.6 |
| Iowa | 112 | 5 | 93 | 83 | 3,238,387 | 3.5 |
| Pennsylvania | 108 | 15 | 88 | 80 | 13,059,432 | 0.8 |
| Georgia | 105 | 14 | 103 | 93 | 11,302,748 | 0.9 |
| North Carolina | 103 | 11 | 85 | 76 | 11,197,968 | 0.9 |
| Arkansas | 100 | 7 | 97 | 72 | 3,114,791 | 3.2 |
| Oregon | 100 | 10 | 75 | 38 | 4,273,586 | 2.3 |
| Indiana | 99 | 13 | 81 | 67 | 6,973,333 | 1.4 |
| Illinois | 98 | 18 | 85 | 77 | 12,719,141 | 0.8 |
| North Dakota | 89 | 4 | 73 | 52 | 799,358 | 11.1 |
| Alabama | 84 | 11 | 80 | 70 | 5,193,088 | 1.6 |
| Mississippi | 80 | 10 | 78 | 54 | 2,954,160 | 2.7 |
| Nebraska | 77 | 3 | 74 | 69 | 2,018,006 | 3.8 |
| Arizona | 76 | 15 | 71 | 43 | 7,623,818 | 1.0 |
| Colorado | 74 | 10 | 68 | 51 | 6,012,561 | 1.2 |
| Tennessee | 74 | 9 | 74 | 66 | 7,315,076 | 1.0 |
| Louisiana | 69 | 13 | 69 | 48 | 4,618,189 | 1.5 |
| South Dakota | 69 | 2 | 57 | 39 | 935,094 | 7.4 |
| South Carolina | 67 | 9 | 59 | 52 | 5,570,274 | 1.2 |
| Virginia | 63 | 8 | 62 | 62 | 8,880,107 | 0.7 |
| New Mexico | 60 | 6 | 54 | 30 | 2,125,498 | 2.8 |
| Kentucky | 59 | 6 | 58 | 52 | 4,606,864 | 1.3 |
| Nevada | 51 | 4 | 39 | 21 | 3,282,188 | 1.6 |
| Maine | 49 | 2 | 38 | 33 | 1,414,874 | 3.5 |
| Utah | 49 | 1 | 46 | 33 | 3,538,904 | 1.4 |
| Wyoming | 42 | 3 | 35 | 33 | 588,753 | 7.1 |
| New Jersey | 39 | 6 | 34 | 33 | 9,548,215 | 0.4 |
| Massachusetts | 37 | 12 | 34 | 30 | 7,154,084 | 0.5 |
| Maryland | 32 | 6 | 28 | 25 | 6,265,347 | 0.5 |
| West Virginia | 32 | 8 | 29 | 25 | 1,766,147 | 1.8 |
| New Hampshire | 24 | 4 | 20 | 14 | 1,415,342 | 1.7 |
| Connecticut | 20 | 7 | 17 | 12 | 3,688,496 | 0.5 |
| Vermont | 16 | 1 | 12 | 9 | 644,663 | 2.5 |
| Hawaii | 14 | 5 | 14 | 11 | 1,432,820 | 1.0 |
| Delaware | 10 | 2 | 7 | 6 | 1,059,952 | 0.9 |
| Rhode Island | 7 | 2 | 7 | 6 | 1,114,521 | 0.6 |
| District of Columbia | 3 | 3 | 3 | 3 | 693,645 | 0.4 |
Airport, tower, pavement and approach counts are from the FAA NASR cycle effective October 1, 2026, queried October 3, 2026; populations are the Census Bureau's Vintage 2025 estimates for July 1, 2025. The 51 rows sum to 4,714 airports; the remaining 53 of the 4,767 are in Puerto Rico, Guam, the Northern Mariana Islands, American Samoa, the U.S. Virgin Islands and Midway Atoll, plus 32 Pacific island facilities that carry no state code in NASR.
What this data cannot tell you
NASR is an owner-reported inventory updated on a 28-day cycle, and some fields lag reality by months. A fuel code can outlive the fuel tank. A tower listing says nothing about hours. A runway length does not say whether the first 500 feet are displaced, soft or closed by NOTAM this week. The private-use facilities we excluded number more than 14,000 in this cycle, and some of their owners will give permission by phone, so the public-use count is a floor.
Our definitions also make choices you may not share. Counting a tower by its listed local-control frequency rather than the FAA's facility list is deliberate, because it is what you will hear on the radio, but it will differ from other published tower counts by a few airports. Water-only runways were excluded from the length distribution. Percentages are rounded to one decimal.
Treat every number here as a reason to open the Chart Supplement, read the NOTAMs and call the FBO, not as a substitute for any of the three.
Where to look these up for one airport
Each FlyFren airport page shows the NASR fields used here for a single field: runways with surface and length, frequencies, listed fuel and published procedures, alongside the current METAR and TAF. It is a planning companion for supplemental use; the Chart Supplement and your briefing remain the official sources. Open the page for the airport halfway down your next cross-country and check three things: fuel, an approach, and the runway length against your POH on a 30°C day. Then call the FBO.
This article is educational and is not a substitute for the current regulations, the AIM, official weather briefings, or instruction from a CFI. Check the current text at the linked sources before you rely on any detail.
- Logged by
- The FlyFren Team
- Pilots and engineers building FlyFren
- Filed under
- Flight planning